| Fundamentals of Statistics contains material of various lectures and courses of H. Lohninger on statistics, data analysis and chemometrics......click here for more. |
|
Home  Bivariate Data Calibration Calibration Bivariate Data Calibration Calibration |
|
| See also: multivariate calibration, regression |   |
CalibrationWhen performing an experiment, the parameters measured immediately are often not the parameters the experimenter is interested in. Someone may be interested, for example, in the concentration of a substance while measuring absorbances at certain wavelengths. In order to find the relationship between the actually measured data (i.e. the absorbances) and the property of interest (i.e. the concentration), one has to set up a calibration, i.e. a functional relationship between the measured data and the parameters of interest. Since the calibration of instruments is a crucial task, many calibration procedures have been developed. In summary, the calibration methods can be divided into four groups, depending on the number of input variables and the type of transfer function. One or two examples are given for each category: 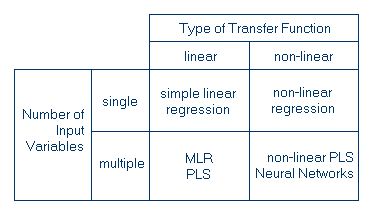 The calibration of an instrument is only possible if one knows which type of model to apply. Start the following interactive example to see several aspects of models and calibration. In general, one should ensure that the number of calibration points
exceeds the number of parameters to be determined. A rule of thumb states
that one should use at least three times as many calibration points as
parameters. This means that for a simple linear univariate calibration
curve, you should use 6 calibration points (a line is determined by two
parameters).
|
|
| Home Bivariate Data Calibration Calibration |
|