| Fundamentals of Statistics contains material of various lectures and courses of H. Lohninger on statistics, data analysis and chemometrics......click here for more. |

|
Home  Univariate Data Distributions Common Distributons Discrete Distributions Hypergeometric Distribution Univariate Data Distributions Common Distributons Discrete Distributions Hypergeometric Distribution |
|||||||||||||
| See also: Binomial Distribution, relationship between distributions |   |
||||||||||||
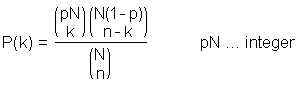
Hypergeometric DistributionThe hypergeometric distribution is a discrete distribution and is used to describe the probability to find k observations of class 1 when n objects are drawn from a population of N objects, and the probability of a single element of class 1 equals p.
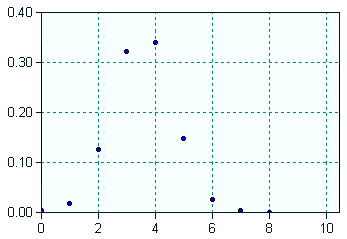
ExampleSuppose you have 20 balls in a bag, 8 blue ones, and 12 red ones. Now mix the balls in the bag and draw 15 balls. What is the probability to draw exactly 5 blue balls and 10 red balls? The answer to this question is given by the hypergeometric distribution function:
N = 20
|
|||||||||||||
| Home Univariate Data Distributions Common Distributons Discrete Distributions Hypergeometric Distribution |
|
||||||||||||