| Fundamentals of Statistics contains material of various lectures and courses of H. Lohninger on statistics, data analysis and chemometrics......click here for more. |

|
Home  Bivariate Data Correlation Contingency Coefficient Bivariate Data Correlation Contingency Coefficient |
|||
  |
|||
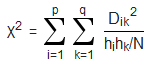
Contingency CoefficientIf we look at the contingency table of two uncorrelated nominal variables, we can calculate the frequency of a particular combination of features hij as hik = hihk/N In the case of a correlation of the two variables the actual frequencies Hik will deviate from the ideal uncorrelated frequencies hik. The difference Dik between ideal (uncorrelated) und actual frequencies thus calculates as Dik = Hik - hik = Hik - hihk/N. For uncorrelated variables the difference of frequencies will be around zero for each cell of the table. Thus the correlation of the two variables can be measured by squaring the relative differences and calculating the sum of these squares in relation to the ideal frequencies:
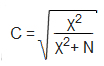
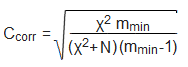
The resulting χ2 coefficient, however, has the disadvantage that its value depends both on the dimension of the contingency table and on the size of the sample. After eliminating the dependence on the sample size, we get Pearson's contingency coefficient C:
|
|||
| Home Bivariate Data Correlation Contingency Coefficient |
|
||