| Fundamentals of Statistics contains material of various lectures and courses of H. Lohninger on statistics, data analysis and chemometrics......click here for more. |

|
Home  General Processing Steps Visualization Dot Plots General Processing Steps Visualization Dot Plots |
|
| See also: Histogram |   |
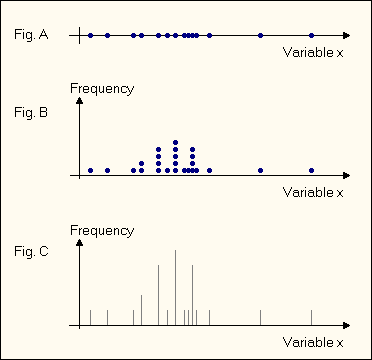
Dot PlotDot plots are drawn by placing a symbol for each observation of a variable X at the corresponding position along a number line (Fig. A). However, this approach exhibits the drawback that equal observations are plotted on top of each other, thus creating a wrong impression of the distribution of the observations (especially when many observations are to be displayed).For that reason this kind of plot is most often drawn as a stacked dot plot where equal observations are displayed as a stack (Fig. B).
|
|
| Home General Processing Steps Visualization Dot Plots |
|