| Fundamentals of Statistics contains material of various lectures and courses of H. Lohninger on statistics, data analysis and chemometrics......click here for more. |

|
Home  Bivariate Data Correlation Autocorrelation Autocorrelation and Scatter Plots Bivariate Data Correlation Autocorrelation Autocorrelation and Scatter Plots |
|
| See also: autocorrelation function, scatter plot |   |
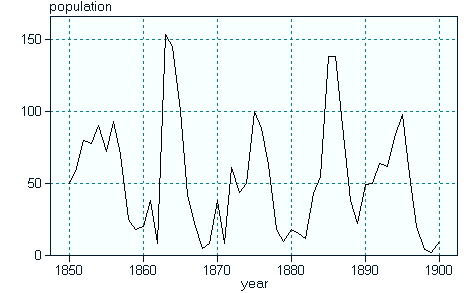
Autocorrelation and Scatter PlotsAutocorrelation can easily be shown when one tries to plot the original value against a time-shifted copy of it. Look, for example, at the population of rabbits. The population shows a regular fluctuation within a period of 10 years.
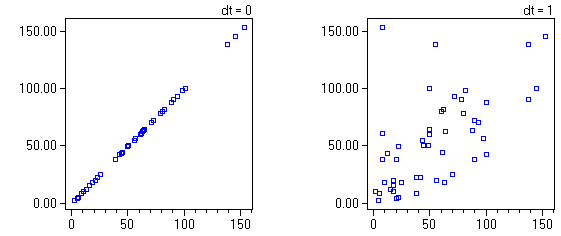
Plotting the rabbit data against itself with no time shift, of course results in a correlation coefficient of 1.0. A time shift of one year already produces a considerably lower correlation coefficient of 0.63.
You should take a closer look at the relationship between the autocorrelation
function and the scatter plots by starting the DataLab .
|
|
| Home Bivariate Data Correlation Autocorrelation Autocorrelation and Scatter Plots |
|