| Fundamentals of Statistics contains material of various lectures and courses of H. Lohninger on statistics, data analysis and chemometrics......click here for more. |

|
Home  Bivariate Data Regression Confidence Interval Bivariate Data Regression Confidence Interval |
|||||||
| See also: regression, derivation of regression formula |   |
||||||
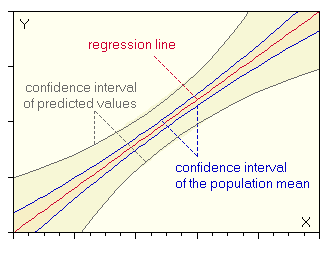
Regression - Confidence IntervalWhen calculating a regression line, one estimates the mean of the population
of Y at any value of X. Thus the regression line represents the mean
If you are plotting the confidence interval for the population regression line, you see that these lines are hyperbolic. This means that the confidence interval depends on the value of X. The farther the value of X departs from
In practical situations the confidence interval of the population mean
is not so frequently required, while most of the inferences are based upon
the estimation of a distinct, future
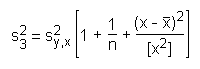
The confidence interval for actual (future) values of Y is wider than
the confidence interval for the population mean (outer, gray curve in figure
above). This demonstrates the fact that the estimate of the actual value
of Y is less precise than the estimate of the mean of Y.
|
|||||||
| Home Bivariate Data Regression Confidence Interval |
|
||||||
 i
at any value of the independent variable X. This estimated mean is
i
at any value of the independent variable X. This estimated mean is  s2 tn-2
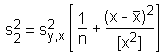
 , the larger is the confidence interval (inner, blue curve of figure below). The band formed by the confidence interval for all X values is also called Working-Hotelling confidence band.