| Fundamentals of Statistics contains material of various lectures and courses of H. Lohninger on statistics, data analysis and chemometrics......click here for more. |

|
Home  Statistical Tests Outlier Tests Significance of Outliers Statistical Tests Outlier Tests Significance of Outliers |
||||||||||||||||||||||||||||||||||||||||||||||||||||||||||||||||||||||||||||||||||||||||||||||||||||||||||||||||||||||||||||||
| See also: Dean-Dixon Test, Grubbs' Outlier Test |   |
|||||||||||||||||||||||||||||||||||||||||||||||||||||||||||||||||||||||||||||||||||||||||||||||||||||||||||||||||||||||||||||
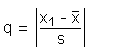
Significance of OutliersFor random samples larger than 30 objects(1) possible outliers may be identified by using the significance thresholds of Pearson and Hartley. For this purpose the test statistic q has to be calculated as follows:
x1 is regarded to be an outlier if the test statistic q exceeds the critical threshold qcrit for a given level of significance α and a sample size n.
|
||||||||||||||||||||||||||||||||||||||||||||||||||||||||||||||||||||||||||||||||||||||||||||||||||||||||||||||||||||||||||||||
| Home Statistical Tests Outlier Tests Significance of Outliers |
|
|||||||||||||||||||||||||||||||||||||||||||||||||||||||||||||||||||||||||||||||||||||||||||||||||||||||||||||||||||||||||||||
 ....
....